BMI Chart for Women: Understanding Your Results by Age and Height
A practical BMI reference chart for women, with height-by-weight tables, age-related context, and guidance on what the numbers mean for your health.
- bmi
- bmi chart
- women
- healthy weight
- bmi ranges
Medical Disclaimer: This article is educational and does not constitute medical advice. BMI is a screening tool, not a clinical diagnosis. Speak with your doctor for personalised guidance.
BMI applies the same four-category framework to all adults regardless of sex — but there are meaningful differences in how women’s bodies carry weight, how BMI shifts across the lifespan, and how the number should be interpreted for women specifically. This guide walks through the reference chart, the age-related nuances, and what to do with your result.
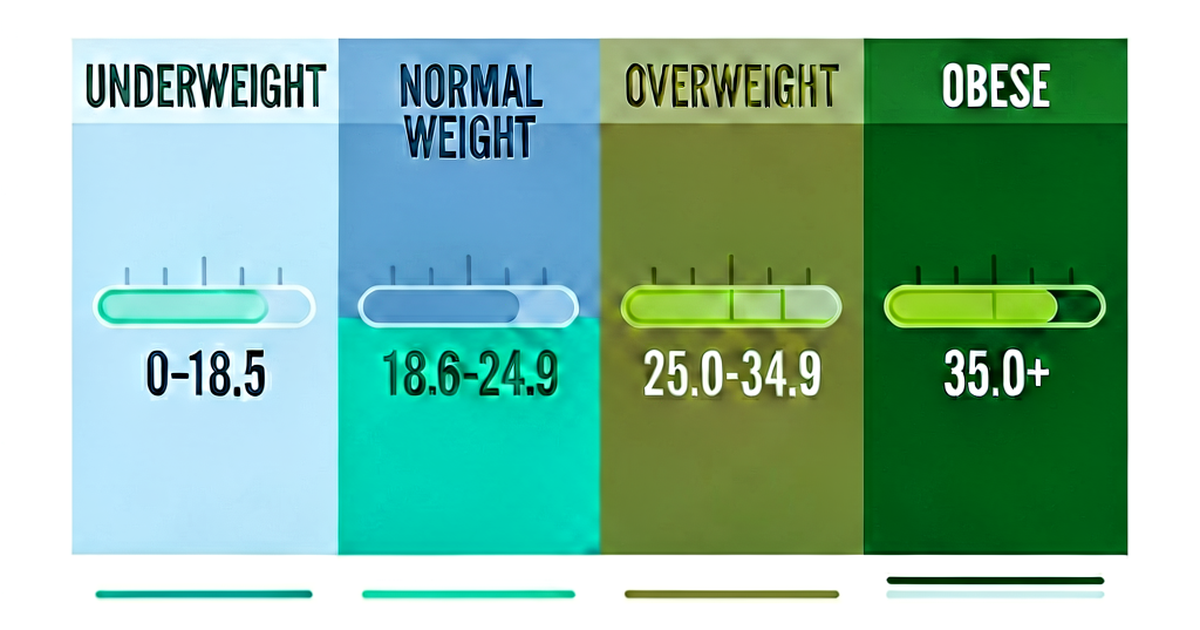
BMI Categories: The Standard Framework
The Centers for Disease Control and Prevention (CDC) and World Health Organization (WHO) use the same cut-points for adult women and men:
| BMI | Category |
|---|---|
| Below 18.5 | Underweight |
| 18.5 – 24.9 | Normal weight |
| 25.0 – 29.9 | Overweight |
| 30.0 – 34.9 | Obese (Class I) |
| 35.0 – 39.9 | Obese (Class II) |
| 40.0 and above | Severely obese (Class III) |
Source: CDC — Adult BMI
BMI Reference Chart for Women by Height
The table below shows the weight ranges that correspond to Normal weight (BMI 18.5–24.9) and Overweight (BMI 25–29.9) for common women’s heights. Use it as a rough orientation — your BMI calculator gives you the exact number.
| Height | Underweight (< 18.5) | Normal weight (18.5–24.9) | Overweight (25–29.9) | Obese (≥ 30) |
|---|---|---|---|---|
| 5’0” (152 cm) | Under 94 lbs | 94 – 127 lbs | 128 – 153 lbs | 154+ lbs |
| 5’2” (157 cm) | Under 100 lbs | 100 – 136 lbs | 137 – 163 lbs | 164+ lbs |
| 5’4” (163 cm) | Under 108 lbs | 108 – 145 lbs | 146 – 173 lbs | 174+ lbs |
| 5’6” (168 cm) | Under 115 lbs | 115 – 154 lbs | 155 – 185 lbs | 186+ lbs |
| 5’8” (173 cm) | Under 122 lbs | 122 – 164 lbs | 165 – 196 lbs | 197+ lbs |
| 5’10” (178 cm) | Under 129 lbs | 129 – 174 lbs | 175 – 208 lbs | 209+ lbs |
| 6’0” (183 cm) | Under 137 lbs | 137 – 184 lbs | 185 – 221 lbs | 222+ lbs |
Weights rounded to the nearest pound.
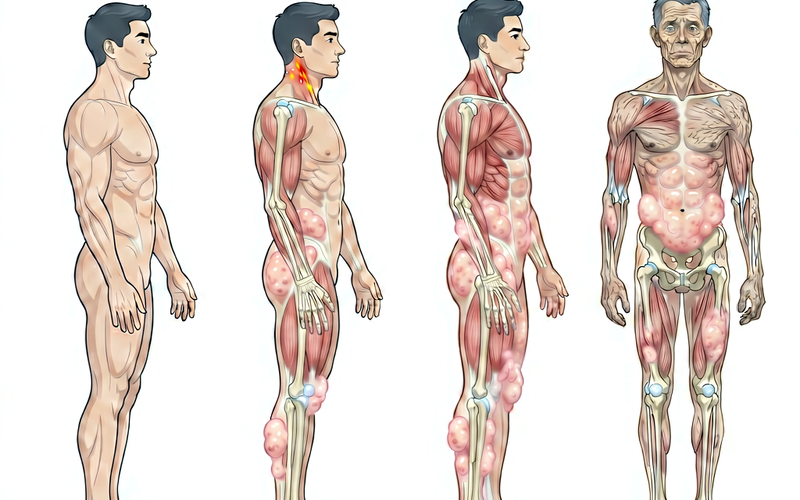
How BMI Changes with Age in Women
BMI as a number does not automatically adjust for age, but the relationship between BMI and health risk does shift as women get older. Three patterns are worth knowing:
1. Body fat percentage rises with age at the same BMI
A 30-year-old woman and a 60-year-old woman with BMI 24 will not have the same body composition. Older women typically carry a higher percentage of body fat at any given BMI because lean muscle mass (which is denser than fat) declines with age. Some researchers argue that the upper threshold for “healthy” BMI should be relaxed slightly for women over 65 — around 25–27 — because modest overweight in this group is associated with reduced fracture risk and better survival during illness. (NIH — Body Weight in Older Adults)
2. Menopause redistributes fat
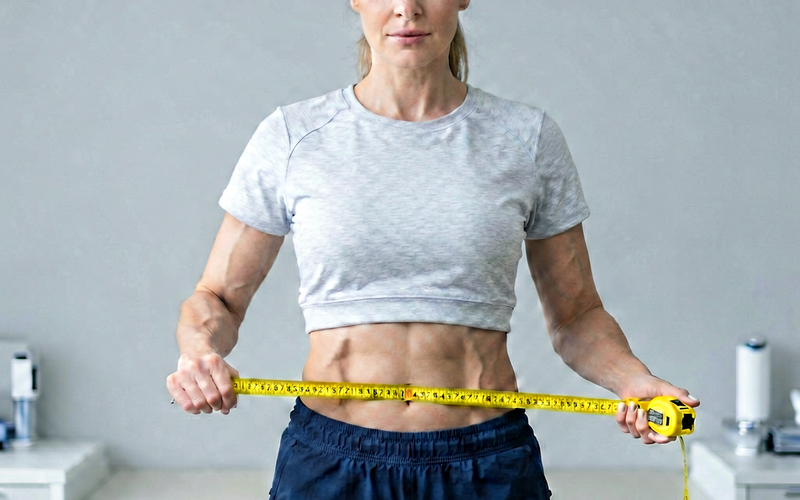
After menopause, women tend to accumulate more abdominal (visceral) fat even without significant changes in total body weight or BMI. Visceral fat carries higher cardiovascular and metabolic risk than subcutaneous fat stored in the hips and thighs. A BMI of 24 in a post-menopausal woman with a large waist circumference may present more metabolic risk than the same BMI in a pre-menopausal woman with the same weight distributed differently. Waist circumference is a useful companion measure: a waist above 35 inches (88 cm) is considered a risk marker for women, regardless of BMI. (CDC — Assessing Your Weight)
3. BMI during and after pregnancy
Standard BMI ranges are not applicable during pregnancy. Weight gain recommendations from the Institute of Medicine depend on pre-pregnancy BMI: underweight women should gain 28–40 lbs; normal weight women 25–35 lbs; overweight women 15–25 lbs; obese women 11–20 lbs. Postpartum, many women’s BMI takes 6–12 months to return to pre-pregnancy baseline.
Why Women Naturally Carry More Body Fat
At any given BMI, women on average have 6–11% more body fat than men of the same age. This is physiologically normal — higher estrogen levels promote fat storage, particularly in the hips, thighs, and breasts, where fat supports reproductive function. This means that a woman and a man with identical BMIs are not equivalent in body composition. The BMI chart above reflects this context: the same numerical range applies to both sexes, but what it implies about body fat and health risk differs.
Women of Asian Descent
Research consistently shows that women of East and South Asian descent face elevated risk of conditions like type 2 diabetes and cardiovascular disease at lower BMI values than the standard cut-points suggest. The WHO has published alternative thresholds for Asian populations, noting that health risks begin to increase at BMI ≥ 23 (rather than 25) and that obesity-equivalent risks arise around BMI 27.5 (rather than 30). If you have Asian heritage, discuss these alternative thresholds with your doctor. (WHO — BMI for Asian populations)
What to Do with Your Number
- Get your exact BMI. Use our BMI calculator with your current height and weight.
- Combine it with waist measurement. If your BMI is in the overweight range, a waist above 35 inches adds an independent risk signal.
- Note the trend. A BMI creeping up 1–2 points per decade is common and worth discussing with a doctor.
- Don’t use BMI alone. Blood pressure, fasting glucose, lipid panel, and physical activity level all inform the picture BMI cannot complete.
Related reading
-
What Is a Healthy BMI? Ranges, Categories, and What They Mean
Learn what a healthy BMI range is for adults, how the four official categories work, and why your number is a starting point—not a verdict.
-
BMI Calculator for Women: What Your Number Means and Why It Matters
Use our BMI calculator for women to check your body mass index. Learn how BMI applies to women, what the ranges mean, and when to look beyond the number.
-
Normal BMI Range: What 18.5–24.9 Really Means for Your Health
A normal BMI range of 18.5 to 24.9 is the standard for healthy weight. Learn what this range means, how it varies by age and sex, and why your number inside the range matters less than being in it.